
Financial ratios are one of the most widely used tools in financial analysis for evaluating the performance and condition of a business. In simple terms, financial ratios are numerical relationships between different financial figures derived from a company’s financial statements. These ratios help convert raw financial data into meaningful insights that can be easily interpreted by investors, lenders, managers, and financial analysts.
A company’s financial statements—primarily the balance sheet, income statement, and cash flow statement—contain a large amount of financial information. However, reviewing individual numbers alone may not provide a clear understanding of a company’s financial position. Financial ratios simplify this process by comparing relevant financial figures to reveal patterns, trends, and relationships that reflect a company’s overall financial picture.
For example, a financial analyst may compare a company’s current assets with its current liabilities to determine whether the company can meet its short-term obligations. Similarly, profitability ratios compare income with revenue or assets to assess how efficiently the company is generating profits. Through such comparisons, financial ratios transform complex financial data into practical indicators of performance and stability.
Financial ratios are essential for conducting comprehensive financial analysis because they allow stakeholders to evaluate multiple aspects of a company’s operations and financial condition. Investors often use ratios to determine whether a company is financially healthy and capable of generating returns. Lenders and creditors rely on ratio analysis to assess the level of financial risk associated with extending credit. At the same time, company management uses financial ratios to monitor performance, identify operational inefficiencies, and make informed strategic decisions.
Another important advantage of financial ratios is their ability to highlight potential financial concerns at an early stage. By analyzing trends in ratios over time, analysts can identify signs of financial strain, such as increasing financial liabilities, declining profitability, or weakening liquidity. This early insight allows businesses and stakeholders to take corrective measures before financial problems escalate.
Financial ratios also help assess a company’s financial stability by showing how effectively it manages its assets, liabilities, and profits. When analyzed together, these ratios provide a clearer understanding of a company’s financial health and its ability to sustain operations, manage financial obligations, and support future growth.
In addition, financial ratios play a crucial role in advanced financial practices such as Financial Modeling, where analysts use historical financial data and ratios to project future performance and evaluate potential investment opportunities.
Overall, financial ratios serve as powerful analytical tools that help transform data from a company’s financial statements into actionable insights. By examining relationships between key financial figures, stakeholders can gain a deeper understanding of a company’s financial health, operational efficiency, and potential financial risks. In the following sections, we will explore the definition, types, formulas, and practical applications of financial ratios in greater detail.
A financial ratio is a numerical value that expresses the relationship between two financial figures taken from a company’s financial statements. It is used to evaluate different aspects of a business, such as profitability, liquidity, efficiency, and financial stability. By comparing relevant numbers from the income statement, balance sheet, or cash flow statement, financial ratios help transform raw financial data into meaningful indicators that reflect a company’s financial health.
In simple terms, a financial ratio shows how one financial figure relates to another. Instead of looking at large or isolated numbers in a company’s financial statements, ratios make it easier to interpret financial information by presenting it in a comparative format. This allows financial analysts, investors, and business managers to better understand a company’s financial picture and identify strengths or weaknesses in its operations.
Financial ratios are widely used in comprehensive financial analysis because they provide a structured way to interpret financial data. A company’s financial statements contain many figures such as revenue, expenses, assets, liabilities, and equity. However, analyzing these figures individually may not reveal the true financial condition of the business. Financial ratios address this challenge by comparing key financial figures to evaluate performance, financial risk, and operational efficiency.
For example, one of the most commonly used ratios is the Current Ratio, which measures a company’s ability to meet its short-term financial obligations. It compares current assets with current liabilities using the following formula:
Current Ratio = Current Assets ÷ Current Liabilities
If a company has sufficient current assets to cover its short-term financial liabilities, it generally indicates strong liquidity and lower financial risk.
Another widely used financial ratio is the Profit Margin, which measures how much profit a company generates from its revenue. This ratio helps assess how efficiently a business converts sales into profit. The formula for net profit margin is:
Net Profit Margin = Net Profit ÷ Revenue
A higher profit margin typically indicates better operational efficiency and stronger financial performance.
These examples illustrate how financial ratios help simplify complex financial information. By comparing financial figures from a company’s financial statements, ratios provide valuable insights into the company’s financial health, its ability to manage financial liabilities, and its overall financial stability. As a result, financial ratios have become essential tools for financial analysts and decision-makers seeking to evaluate business performance and assess potential financial risks.
The MNS Business Information Report delivers a comprehensive analysis of a company, covering both financial and non-financial parameters. It includes key financial ratios such as Profitability, Liquidity, and Efficiency ratios, helping leadership gain a clear and reliable view of a company’s financial health and operational performance.
Apply Here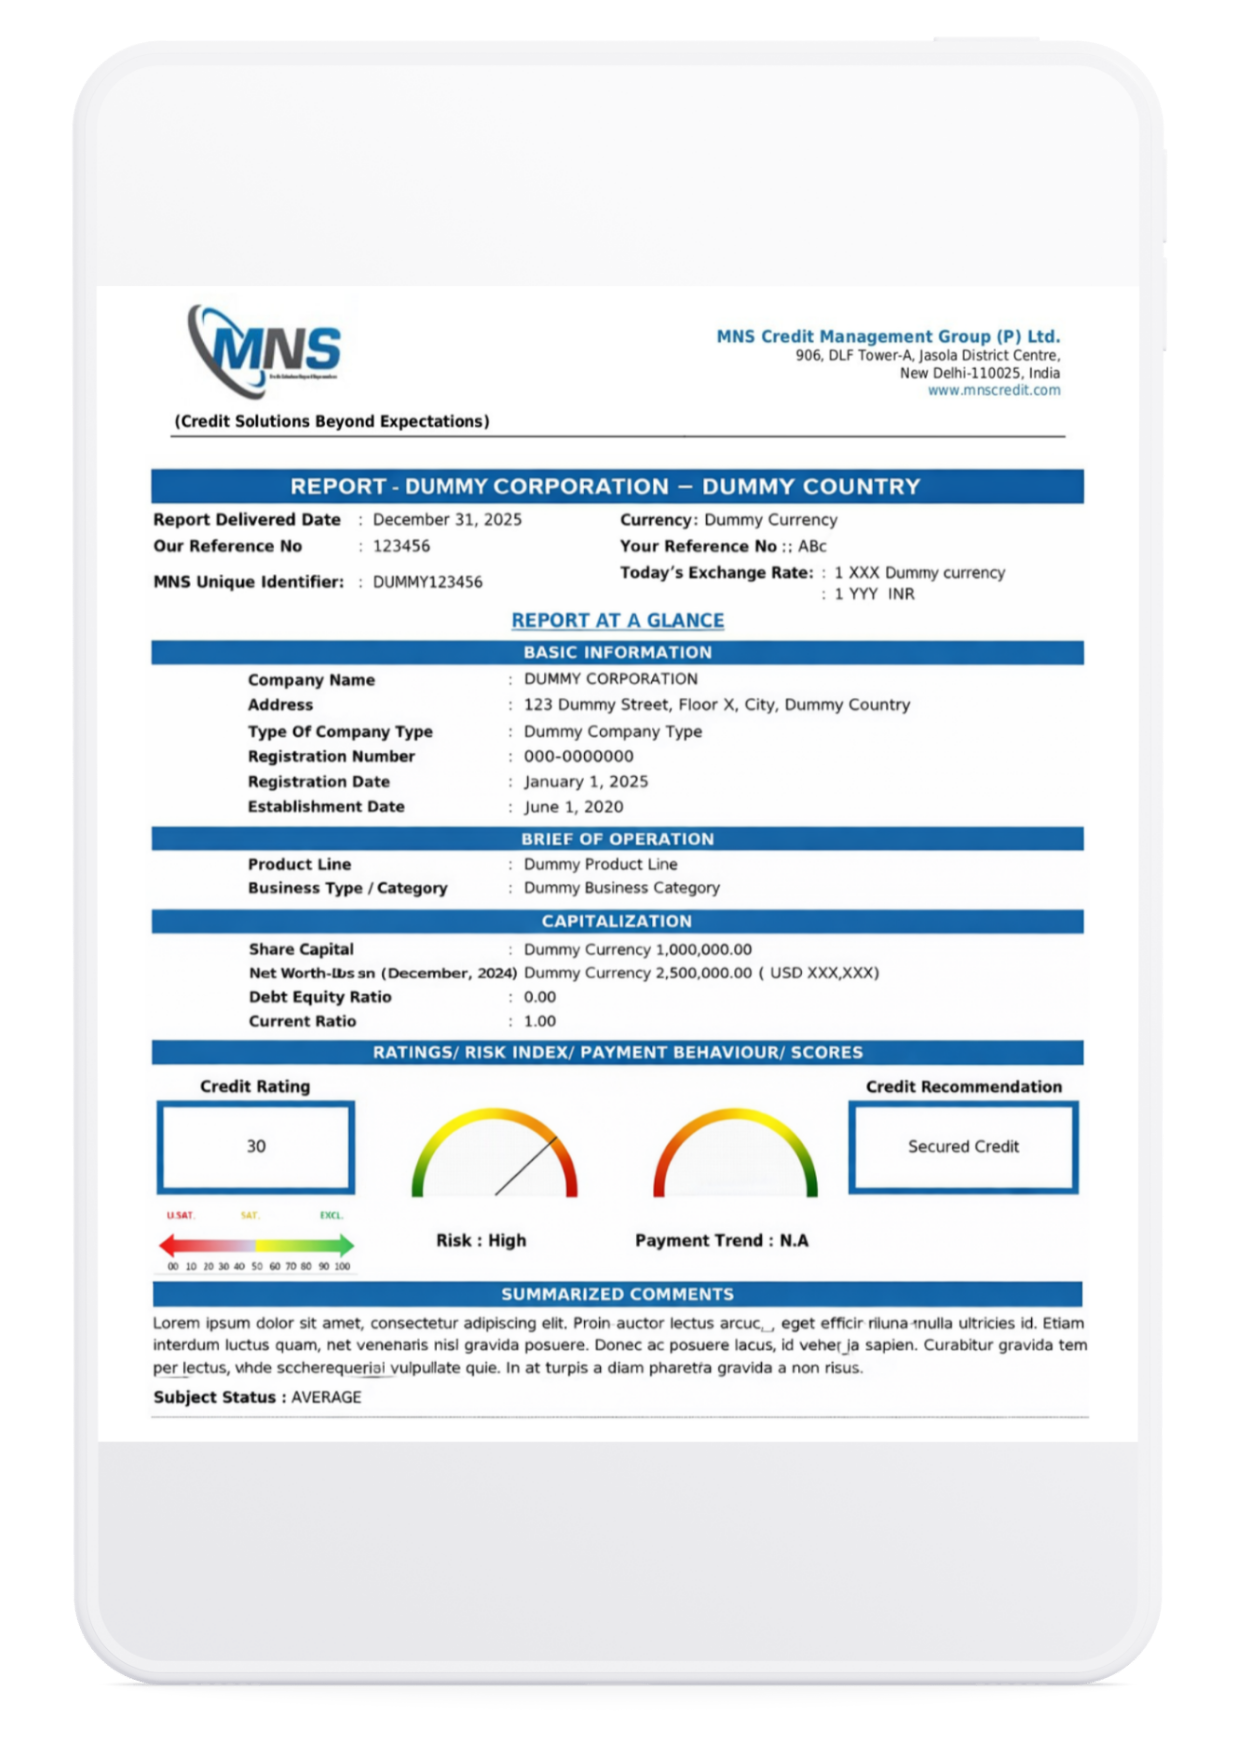
Financial ratios play a critical role in interpreting financial data and turning it into meaningful insights for decision-making. While a company’s financial statements contain numerous financial figures, these numbers alone may not provide a clear understanding of the organization’s financial health. Financial ratios help bridge this gap by allowing stakeholders to evaluate performance, assess financial risk, and gain a clearer view of a company’s financial picture.
By comparing key financial figures from a company’s financial statements, financial ratios provide a structured approach to comprehensive financial analysis. They enable different stakeholders—including investors, lenders, management teams, and financial analysts—to evaluate various aspects of a company’s operations and financial stability.
Investors often rely on financial ratios to determine whether a company is capable of generating consistent profits and delivering returns on investment. Profitability ratios such as profit margin, return on assets (ROA), and return on equity (ROE) provide insights into how efficiently a company converts revenue into profit.
These ratios help investors assess whether a company’s financial performance aligns with their investment goals. A business with strong profitability ratios generally indicates effective cost management, stable revenue generation, and a healthy financial position. As a result, financial ratios allow investors to make more informed decisions when selecting potential investment opportunities.
Financial ratios are also widely used by lenders and creditors to evaluate the creditworthiness of a business before extending loans or credit facilities. Ratios related to liquidity and solvency help determine whether a company has the capacity to meet its financial obligations.
For example, liquidity ratios measure a company’s ability to cover short-term financial liabilities, while leverage ratios assess the level of debt relative to equity or assets. If a company shows high levels of financial liabilities or limited liquidity, lenders may perceive higher financial risk. On the other hand, strong ratio indicators can demonstrate financial stability and increase the likelihood of obtaining credit.
Companies themselves use financial ratios as internal tools to monitor and improve performance. By regularly analyzing ratios derived from their financial statements, businesses can identify areas where efficiency can be improved or where financial strain may be developing.
For example, declining profitability ratios may indicate rising operational costs, while weakening liquidity ratios could signal potential cash flow challenges. Through ongoing ratio analysis, management can detect such issues early and implement strategies to maintain financial stability and support sustainable growth.
Financial ratios are particularly useful for financial analysts who compare multiple companies within the same industry. Since businesses often vary significantly in size, revenue, and asset levels, direct comparison of raw financial figures may not provide meaningful insights.
Financial ratios standardize financial information, allowing analysts to evaluate companies on a comparable basis. By analyzing ratios across similar businesses, analysts can identify industry leaders, assess relative financial strength, and detect potential financial risks.
Overall, financial ratios provide a practical and effective method for understanding a company’s financial position. Whether used by investors, lenders, management teams, or financial analysts, these ratios transform financial figures into valuable insights that support better financial decision-making and a deeper understanding of a company’s financial health.
Financial ratios are generally grouped into different categories based on the specific aspect of a company’s financial performance they measure. Since businesses generate large volumes of financial figures through their operations, categorizing ratios helps financial analysts evaluate a company’s financial health in a structured and systematic manner.
Each category of financial ratios focuses on a particular dimension of a company’s financial picture, such as liquidity, profitability, operational efficiency, or financial stability. By analyzing these different categories together, stakeholders can conduct a comprehensive financial analysis and gain deeper insights into the company’s strengths, weaknesses, and potential financial risks.
Most financial ratios are derived from the information presented in a company’s financial statements, including the balance sheet, income statement, and cash flow statement. These ratios allow analysts to compare financial figures and evaluate how effectively a company manages its resources, generates profits, and meets its financial obligations.
The major types of financial ratios commonly used in financial analysis include the following:
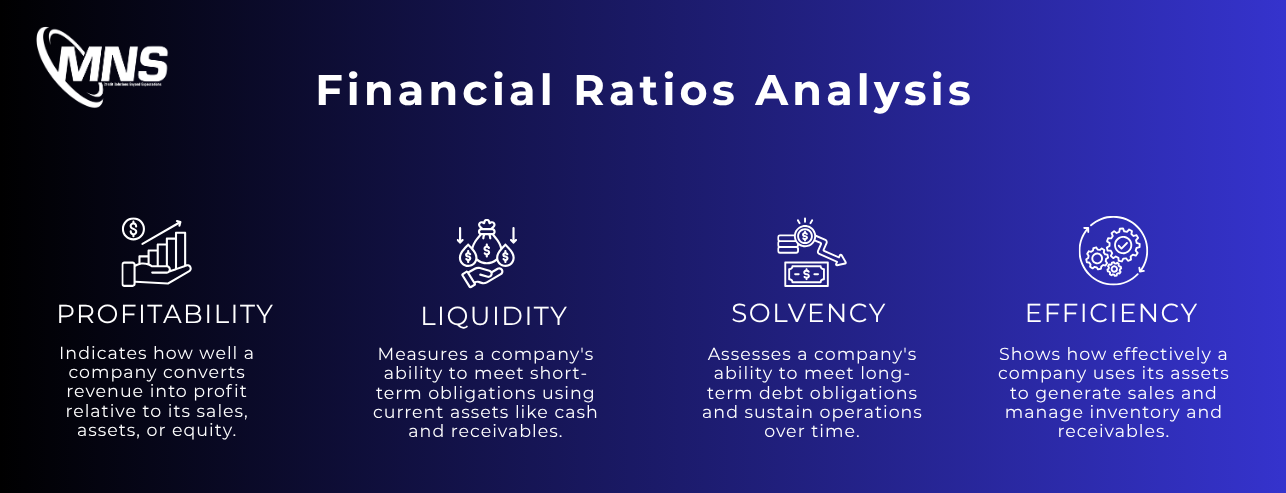
Profitability ratios measure how effectively a business generates profit from its revenue, assets, and shareholders’ equity. These ratios help assess operational efficiency, cost management, and overall earning capacity. For investors, lenders, and business leaders, profitability ratios provide clear insight into whether a company is creating sustainable value and maintaining healthy margins in a competitive market.
Examples of Profitability Ratios:
1. Net Profit Ratio or Net Profit Margin: This ratio indicates the percentage of total income that remains as profit after deducting all expenses, taxes, and losses from total income. It reflects the overall profitability of a company.
PAT = Profit after Tax
Total Income = Revenue from Sales + Other Income
2. Profit Before Tax (PBT Margin): This ratio provides insight into the company's profitability from its core operations before tax liabilities.
PBT = This is the profit a company makes before deducting any taxes. It includes operating income, interest income, and other income, minus interest expenses and other expenses.
Net Sales = Revenue from Sales
3. Return on Capital Employed (ROCE): Where PBT is the same as above and Total Assets comprise current assets (like cash, inventory, receivables) and fixed assets such as tangible and intangible assets.
4. Return on Investment (ROI): Where PBT is the same as above and Net Worth is the same as equity, which includes Share Capital and Reserves & Surplus.
Liquidity Ratios:
Liquidity ratios evaluate a company’s ability to meet its short-term financial obligations using its current assets. These ratios indicate how well a business can manage working capital, maintain smooth operations, and handle unexpected cash flow pressures. For lenders and management teams, liquidity ratios are critical in assessing financial stability and short-term solvency.
1. Current Ratio: The current ratio is a financial metric used to evaluate a company's ability to pay off its short-term liabilities with its short-term assets.
2. Quick Ratio (Acid-Test Ratio): The quick ratio checks if a company can pay its short-term bills right now — without needing to sell its inventory first.
Think of it this way: inventory takes time to sell. So this ratio only counts the money and assets a company can access quickly — like cash, bank balances, and receivables. That's why it's considered a stricter, more honest test of a company's financial health compared to the current ratio.
Solvency Ratio:
Solvency ratios assess a company’s ability to meet its long-term financial obligations and sustain operations over time. These ratios evaluate the balance between debt and equity, indicating how financially stable and leveraged a business is. Investors and lenders rely on solvency ratios to determine long-term risk exposure and the company’s capacity to manage debt responsibly.
1. Debt-to-Equity Ratio: This is a financial leverage ratio that compares a company's total debt to its total equity. It provides insight into how much debt the company uses to finance its assets relative to the value of shareholders' equity.
2. Net Debt to Equity (Times): This ratio measures a company's financial leverage by comparing its net debt (total debt minus cash and bank balances) to its equity. Higher values indicate greater leverage.
3. Net Debt to EBITDA (Times): This ratio compares a company's net debt to its earnings before interest, taxes, depreciation, and amortization (EBITDA). It is used to assess a company's ability to repay its debt using its operating earnings.
Efficiency Ratios:
Efficiency ratios measure how effectively a company utilizes its assets and resources to generate revenue. These ratios help assess operational performance, asset management, and overall productivity. By analyzing efficiency ratios, businesses and stakeholders can identify areas where processes can be optimized to improve profitability and cash flow.
1. Debtors / Sales (Days): This ratio shows the average number of days it takes for a company to collect payment from its customers after a sale.
2. Payables / Sales (Days): This ratio indicates the average number of days a company takes to pay its suppliers after purchasing inventory or services.
3. Inventory / Sales (Days): This ratio reflects the average number of days inventory remains unsold. Lower values generally suggest faster inventory turnover.
Other Financial Ratios:
1. Asset Turnover Ratio (Times): This ratio measures how efficiently a company uses its assets to generate sales. Higher values generally indicate better asset utilization and operational efficiency.
2. Inventory Turnover Ratio (Times): This ratio indicates how many times a company's inventory is sold and replaced during a specific period. Higher ratios generally suggest more efficient inventory management.
3. Net Debt / Free Cash Flow to Firm: This ratio assesses a company's ability to repay its net debt using the free cash flow generated by the firm. Lower values generally indicate a stronger financial position and better debt repayment capacity.
Analyzing financial ratios requires more than just applying formulas—it demands accurate financial data, industry benchmarking, and expert interpretation. MNS simplifies this process by integrating financial ratio analysis into its comprehensive Business Information Reports (BIR) and credit evaluation services.
Instead of leaving businesses to interpret raw financial statements, MNS converts complex balance sheet and income statement data into structured insights covering profitability, liquidity, solvency, and efficiency. Each ratio is analyzed in context—compared with industry standards, historical trends, and risk indicators—to provide a clearer picture of financial stability.
For lenders, exporters, and corporate decision-makers, this structured approach reduces uncertainty, enhances credit risk assessment, and supports confident business decisions. By combining financial analytics with on-ground intelligence across 170+ countries, MNS ensures that financial ratio analysis becomes a practical decision-making tool rather than just a numerical exercise.
Calculating financial ratios involves selecting relevant financial statements, applying standard formulas, and interpreting results against industry benchmarks or historical data.
Practical Application:
Financial ratio analysis involves interpreting ratios collectively to understand overall performance, detect risks, and identify opportunities.
Example Insight:
A business may have high profitability but low liquidity, suggesting strong earnings but potential short-term cash flow challenges. Conversely, high liquidity with lower profitability may indicate underutilized assets or operational inefficiency.
Benefits Include:
Financial ratio analysis is used by multiple stakeholders:
Companies that integrate ratio analysis into routine monitoring gain a clear, actionable understanding of financial performance.
Financial ratios and ratio analysis are essential for converting complex financial data into clear insights. By examining liquidity, profitability, solvency, efficiency, and market value, stakeholders gain a comprehensive picture of financial health.
Regular financial ratio analysis allows companies to detect trends early, optimize operations, and make strategic decisions that drive growth and stability.
1. What are financial ratios?
Financial ratios are numerical relationships between two financial figures taken from a company’s financial statements. They are used to evaluate a company’s financial health, profitability, liquidity, and overall financial performance.
2. What are the main types of financial ratios?
Financial ratios are generally classified into five major categories:
Each type of ratio helps assess a different aspect of a company’s financial stability and operational performance.
3. Why are financial ratios important in financial analysis?
Financial ratios are important because they help investors, lenders, and financial analysts interpret financial figures more effectively. They simplify complex financial data from a company’s financial statements and provide insights into profitability, financial risk, operational efficiency, and financial stability.
4. How are financial ratios calculated?
Financial ratios are calculated by comparing two related financial figures from financial statements such as the balance sheet, income statement, or cash flow statement. For example, the current ratio is calculated by dividing current assets by current liabilities.